HiveTool™• Net
Advancing Art through Science
HiveTool How To Videos
A series of short videos that demonstrate different ways to build and deploy the HiveTool hive monitoring system are available on YouTube.
- Aluminum Frame Assembly
- Container Build
- Battery and Charger
- Interface Board and Pi 0
- Solar panel cord build Part A
- Solar Panel cord build Part B

Monitor barometric pressure, VOCs
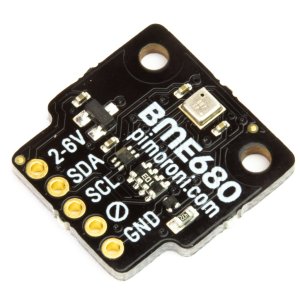
Support has been added for the Bosh BME680 temperature, humidity, air pressure, and VOC sensor. The sensor is available mounted on a breakout board from Adafruit and PiMoroni.
It has both I2C and SPI buses. The BME680 can plug into the LUX RJ11 input. It can be used in lieu of the LUX sensor or wired in parallel with it.
3-D Printed Enclosures
- 3D printed enclosure
- 3D printed sun/rain shield for TSL2195 Lux and BME680 sensors.

DS3231 Real Time Clock
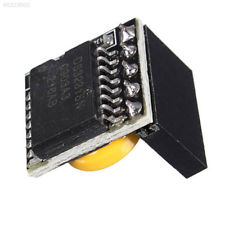
If the Pi is operated without internet access to National Time Protocol (NTP) servers, a battery backed up clock is a must. The DS3231 RTC is supported by both the software and new hive interface board. A battery backed up RTC
New Website
If you've made it here, you've noticed the new website. We've ditched the Drupal CMS for now. It may have had vulnerabilities that allowed the site to be hacked. This completes the migration to Amazon Web Services (AWS). HiveTool now consists of three servers:
- Data Ingress - XML API based on Perl and MySQL
- Public Websites - HTML/CSS, Mediawiki and MySQL
- Data Warehouse - Mediawiki, PostgreSQL
We apologise for any inconvenience or loss of services (forum, google maps). Please excuse the mess as we develop new features that we hope will improve our content, analysis and visualization tools.
Download Image Ver. 0.8.3
HiveTool™ Image Version 0.8.3 is available for download.
Recent Changes:
- Built on Raspbian Stretch OS
- Scale Calibration Wizard
- Metric or Imperial measurements
- Hardware Real Time Clock Support
- Web Upload Testing
- Flexible Sensor Scaling
- Local & Cloud Data Collection
gnuplot graphing engine

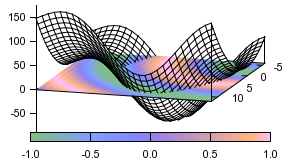
The graphs on this server are now generated with gnuplot. It will be included in the 0.8.4 release for the Pi. With it's powerful scripting language, gnuplot plots two-dimensions in many different styles (points, lines, error bars) and three-dimensions data points and surfaces in contour and mesh. This opens up a lot of possibilities for new ways of looking at the data.